Workforce
Greater Hazleton’s Dedicated Workforce
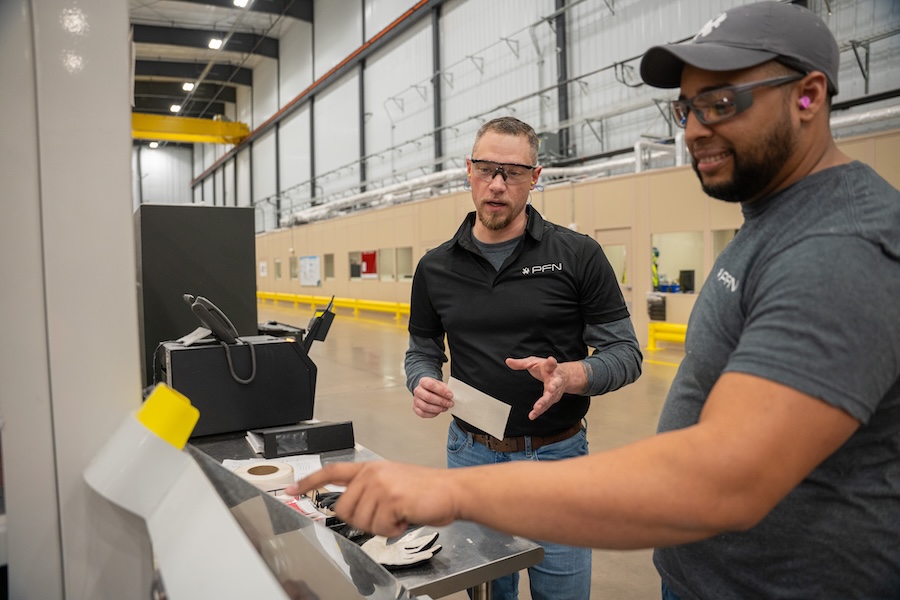
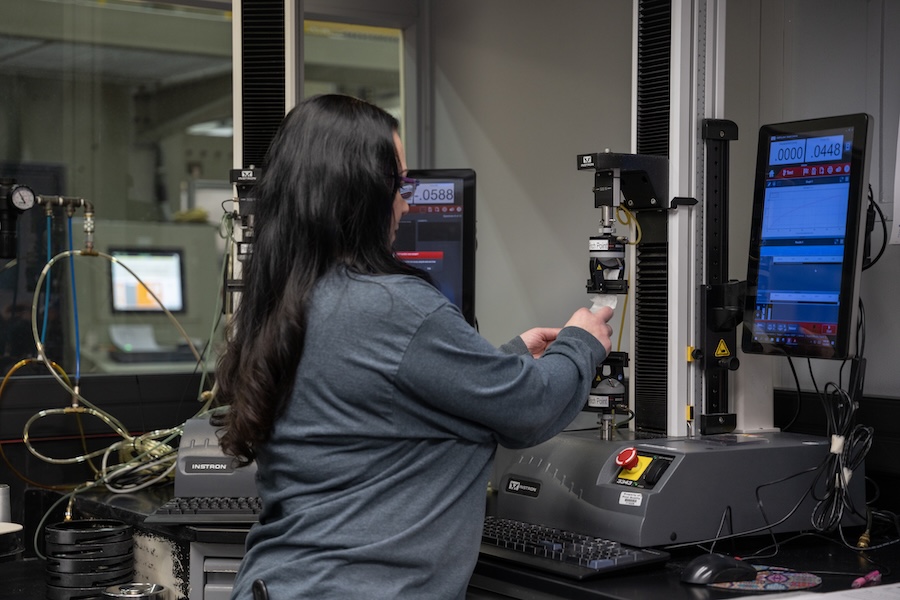
Greater Hazleton is known for its high-quality, reliable, skilled workforce. Companies also find that the proximity of Greater Hazleton to Interstates 80 and 81 provides access to a population of over 1.1 million people with a civilian workforce of more than 545,000 within a 60-mile ‘commute shed’ radius.

552,233
Civilian Labor Force

3.7%
Unemployment Rate

27.6
Commute Time
Employment By Occupation
| Occupation | Greater Hazleton Area | Luzerne/Schuylkill | NEPA |
| Transportation and Material Moving | 24.8% | 16.8% | 13.3% |
| Production | 12.4% | 9.2% | 7.2% |
| Office and Administrative Support | 10.8% | 10.9% | 11.2% |
| Sales and Related | 7.2% | 7.7% | 8.7% |
| Food Preparation and Services Related | 5.7% | 7.0% | 8.6% |
Average Wage by Industry
$45,700
Transportation and Material Moving
$47,800
Production
$45,300
Office and Administrative Support
$45,900
Sales and Related
$31,100
Food Prepatation and Services Related
$57,000
Installation, Maintenance, and Repair
$87,800
Healthcare Practitioners and Technical
$64,200
Educational Instruction and Library
$35,300
Health Care Support
$115,000
Management
Educational Attainment
| Educational Attainment | Greater Hazleton Area | Luzerne/Schuylkill | NEPA |
| No High School Diploma | 14.3% | 9.1% | 8.3% |
| High School Diploma | 37.7% | 36.8% | 36.5% |
| Some College, No Degree | 17.1% | 17.6% | 17.6% |
| Associate’s Degree | 11.0% | 11.8% | 11.0% |
| Bachelor’s Degree | 12.5% | 16.0% | 17.0% |
| Postgraduate Degree | 7.3% | 8.7% | 9.7% |
| Percent High School Graduate or Higher | 85.6% | 90.9% | 91.8% |
| Percent Bachelor’s Degree or Higher | 19.8% | 24.7% | 26.7% |
Higher Education in Greater Hazleton
Greater Hazleton is home to several esteemed educational institutions that play a pivotal role in supporting local industries by offering specialized training programs tailored to meet workforce demands. These institutions include Penn State Hazleton, Luzerne County Community College (LCCC), Lackawanna College, and Johnson College, each contributing uniquely to the region’s educational landscape.
Regional Access to Higher Education
100+
Degree Programs Offered
50k
Students Enrolled
11k
Graduating Annually
15
Colleges and Universities in the Region

Penn State Hazleton
Penn State Hazleton offers an industrial maintenance program culminating in an Advanced Process Automation certificate. This program encompasses courses in industrial mathematics, electricity, motor controls, and programmable logic controllers, equipping students with essential skills for modern industrial environments. Additionally, the campus provides an Alternative Energy and Power Generation track within its General Engineering degree, preparing graduates for careers in the burgeoning alternative and renewable energy sectors.
Luzerne County Community College
Established in September 2000, LCCC’s Hazleton Center is conveniently located in the Broad Street Exchange building in downtown Hazleton. The center offers both day and evening classes, enabling students to pursue various courses and complete specific degree programs with some online components. Programs available at the Hazleton Center include Associate of Science degrees in General Studies, Business Management, Psychology, and Associate of Applied Science degrees in Early Childhood Education.


Lackawanna College
Located in the historic Traders Bank Building in downtown Hazleton, Lackawanna College’s Hazleton Center provides accessible education tailored to the community’s needs. The center empowers students to succeed within a supportive college environment, offering comprehensive academic support. Programs available at the Hazleton Center include English as a Second Language (ESL) classes, ESL to Certificate pathways, and College Prep courses designed to prepare students for collegiate success.
Johnson College
Johnson College’s Hazleton campus, located at the CAN DO Training Center in the Humboldt Industrial Park, is dedicated to delivering industry-focused, hands-on education. The campus features specialized classrooms and lab spaces for its programs, along with a resource center accessible to all students. Programs offered include academic certificates in Welding Technology, Industrial Technology, Building and Property Maintenance, and an associate degree in Electrical Construction Technology. These programs are designed to equip students with practical skills aligned with industry standards, ensuring they are workforce-ready upon graduation.

Collectively, these institutions are instrumental in fostering a skilled workforce in Greater Hazleton. By offering specialized programs and training opportunities, they address the evolving needs of local industries, thereby contributing to the region’s economic growth and vitality.


